Visuals to Attract More Social Shares
Studies have shown that:
Posts with visuals attract 94% more views
Web users tend to connect with visual content in only 13 milliseconds (or less)
A human brain processes visuals 60,000 times faster than plain content
Now that we know images play a crucial role in driving user engagement, let’s see what type of visuals you should use.
Quote Images/Cards
Quotes are a great way to reveal the snippet of a business ethics. They are also amazing in illustrating a point. In fact, they are an outstanding way to make your content aesthetically appealing while highlighting the point. They highlight your brand’s personality, reveal what inspires and must resonate with the belief of your users and followers. As a matter of fact, if the users relate to a quote, they will not hesitate to share it on their own pages.
Quote Images_Cards
If you have any particular quote that you may want to highlight, you can make use of quote card, which is particularly created for this purpose. When designing quote cards, feel free to use your creative side, but also ensure that the message of the design is authentic and relevant.
Tools to create visually appealing quote cards
PickMoney
Snappa
Canva
Animated/GIF Images
In the era of visual content, GIFs images are also enjoying a constant rise in popularity. GIFs are an amazing way to quickly share an emotion or transmit information to others that are overwhelmed with content and prefers image-based interaction.
Animated_GIF Images
They have quickly become an important part of social media today. A study has also shown that:
More than 23 million GIFs are shared on Tumblr on a regular basis
Facebook attracts more than 5 million GIF posts
2 million GIF interactions happen on Slack
These stats certainly prove the popularity of GIFs among web users.
A GIF can be used for a variety of purposes, let’s have a look at some of the ways you can use it.
To explain a process
Sometimes it is a lot convenient to just explain a process in an image than to describe it in words. From how-tos to step-by-step processes, a GIF can prove to be a beneficial tool to make things a lot easier.
To tell a Story
GIFs can also be used to tell a story in an effective and interactive way. You can string multiple still pictures together to create a story of motion.
Use it in a campaign
Have a campaign to promote? Build it with GIFs and see the magic begins. Since GIFs are a compelling and fun way to interact, it makes absolute sense to use them in a campaign or an ad to draw the attention of the users.
To display a product
GIFs allow you to give your customers a closer look at your products. They can offer the kind of details that a customer is looking for.
Tools to create GIF images
Jing
Convert any YouTube Video into a GIF
Infographics
Infographics are a visually compelling interaction medium that is a combination of analysis, writing, and design. They can communicate complicated information in a visual format that promotes social sharing. They are extremely helpful in breaking down your content into an easily comprehended step-by-step process.
Infographic
Reasons to use Infographics:
Increases traffic
According to a study by KISSmetrics, it received more than 41,142 links merely by employing 47 infographics in their blog posts. An infographic that is interactive and fascinating will drive constant traffic to your site and encourage visitors to click and share it.
Brand Awareness
Infographic that consists of your brand’s logo and name serves as a means of spreading brand awareness among web users.
Viral Capabilities
Since infographics are extremely attractive and compelling, they have the capability to be shared on social media and become viral than the ordinary content.
Tools to create Infographics:
Canva
Piktochart
Infogram
Screenshots
Screenshots are yet another way of visually illustrating your point to your audience. A majority of webmasters use screenshots not only to make a plain text content compelling and attractive but also to add credibility to the key points mentioned it the content.
Screenshot
Tools to capture screenshots:
Awesome Screenshot
Snagit
Skitch
Graphical Data
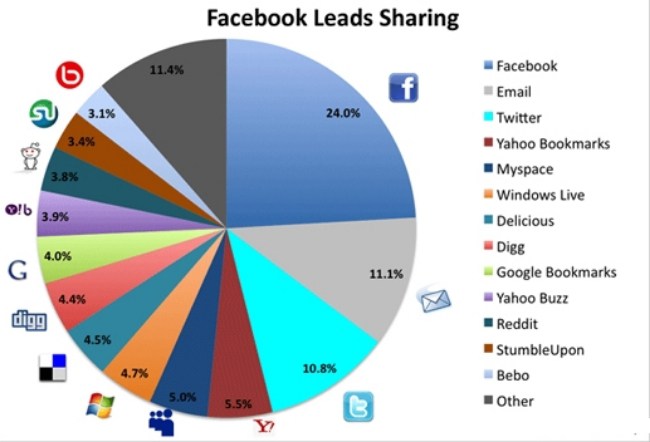
A graphical data includes stock, areas, columns, charts, pies, graphics and so much more. Adding a graphical data to your blog post is another way of making your content visually appealing while supporting your statements with factual information. It adds much more credibility to your blog post and enables your users to analyze relationships and trends in the data gathered. As a matter of fact, quantitative data is a lot easier to describe instead of explaining it in words or numbers.
Graphical Data
Tools to create graphs and charts:
Google Spreadsheet
Canva
Conclusion:
Shareable visuals are the key to developing compelling social media content. There is hardly any network that does not depend on engaging visuals to communicate with its audience. The best way to integrate visuals into your content is to employ images that actually speak to you users. Visuals have the power to enhance the credibility and identity of your business in no time.


